Most ecommerce platform comparison guides rank vendors by theme libraries and monthly fees, then stop. That approach misses the point. Revenue doesn't turn on how many apps a platform lists. It turns on whether checkout completes on a phone in another country, whether inventory and subscription records stay accurate as channels multiply, and what you'll spend to keep integrations running over five years. Measure those three things first, and the shortlist usually looks very different.
Table of Contents
- Why Platform Choice Matters More Than Ever
- Marketplace vs Merchant-Owned Platforms
- Evaluating Checkout Performance and Payments
- Total Cost of Ownership Over Five Years
- Building a Weighted Scoring Framework
- Matching Platforms to Brand Scenarios
- Migration Risk and Parallel-Run Tactics
- Frequently Asked Questions About Platform Selection
Why Platform Choice Matters More Than Ever
UNCTAD estimated that businesses in 43 developed and developing economies generated approximately $27 trillion in ecommerce sales in 2022, with that total 25% higher than the comparable pre-pandemic level in 2019 and almost 60% above the level recorded in 2016, as detailed in UNCTAD's estimate of ecommerce sales across 43 economies. Those economies represented around three-quarters of global GDP and exports, so the figure captures most major markets without covering every country or all consumer-to-consumer activity. Digital ordering didn't retreat after the pandemic surge. It stayed.
What That Scale Changes for Buyers
At that volume, a platform isn't a storefront with a cart attached. It's the system that has to hold catalog, pricing, inventory, customer records, payments, and analytics together across online, retail, subscription, and B2B orders. UNCTAD also found that sales to customers abroad represented about 23% of business ecommerce sales by value on average. Domestic commerce is still larger, but cross-border readiness can't be an afterthought bolted on through plugins.
Most comparisons fail here. They score storefront features and subscription prices because those are easy to screenshot, and they ignore the variables that move revenue.
- Checkout performance: Whether buyers complete payment, on which devices, at what latency, and with which wallets.
- Total cost of ownership: What you pay across fees, payment margin, implementation, app substitutions, and engineering time over years, not months.
- Migration risk: Whether orders, subscriptions, consent, and attribution survive the switch intact.
A platform with more features can underperform a leaner one if its checkout is slow, its data drifts between systems, or its integrations need constant repair.
If you're starting from first principles on shortlisting criteria, this ecommerce platform selection guide from Kogifi is a useful companion for structuring requirements before you talk to vendors. Treat vendor claims as hypotheses. Your job is to turn each one into something you can test, price, or verify in a reference call, then weight it by how your brand sells.
Marketplace vs Merchant-Owned Platforms
Every comparison starts with an architecture decision most buyers make implicitly. Do you sell where demand already exists, or do you build demand on infrastructure you control? Those are different businesses, not just different software.
The marketplace model took its modern shape when Amazon shifted in 2000 from operating primarily as a direct retailer to allowing third-party sellers onto its platform, and by 2025 third-party sellers accounted for 60% of Amazon's sales, according to Shopify's summary of Amazon's third-party seller history. That split shows how completely a platform can become an aggregation layer. The operator owns the customer relationship and the rules. Sellers rent access to both.
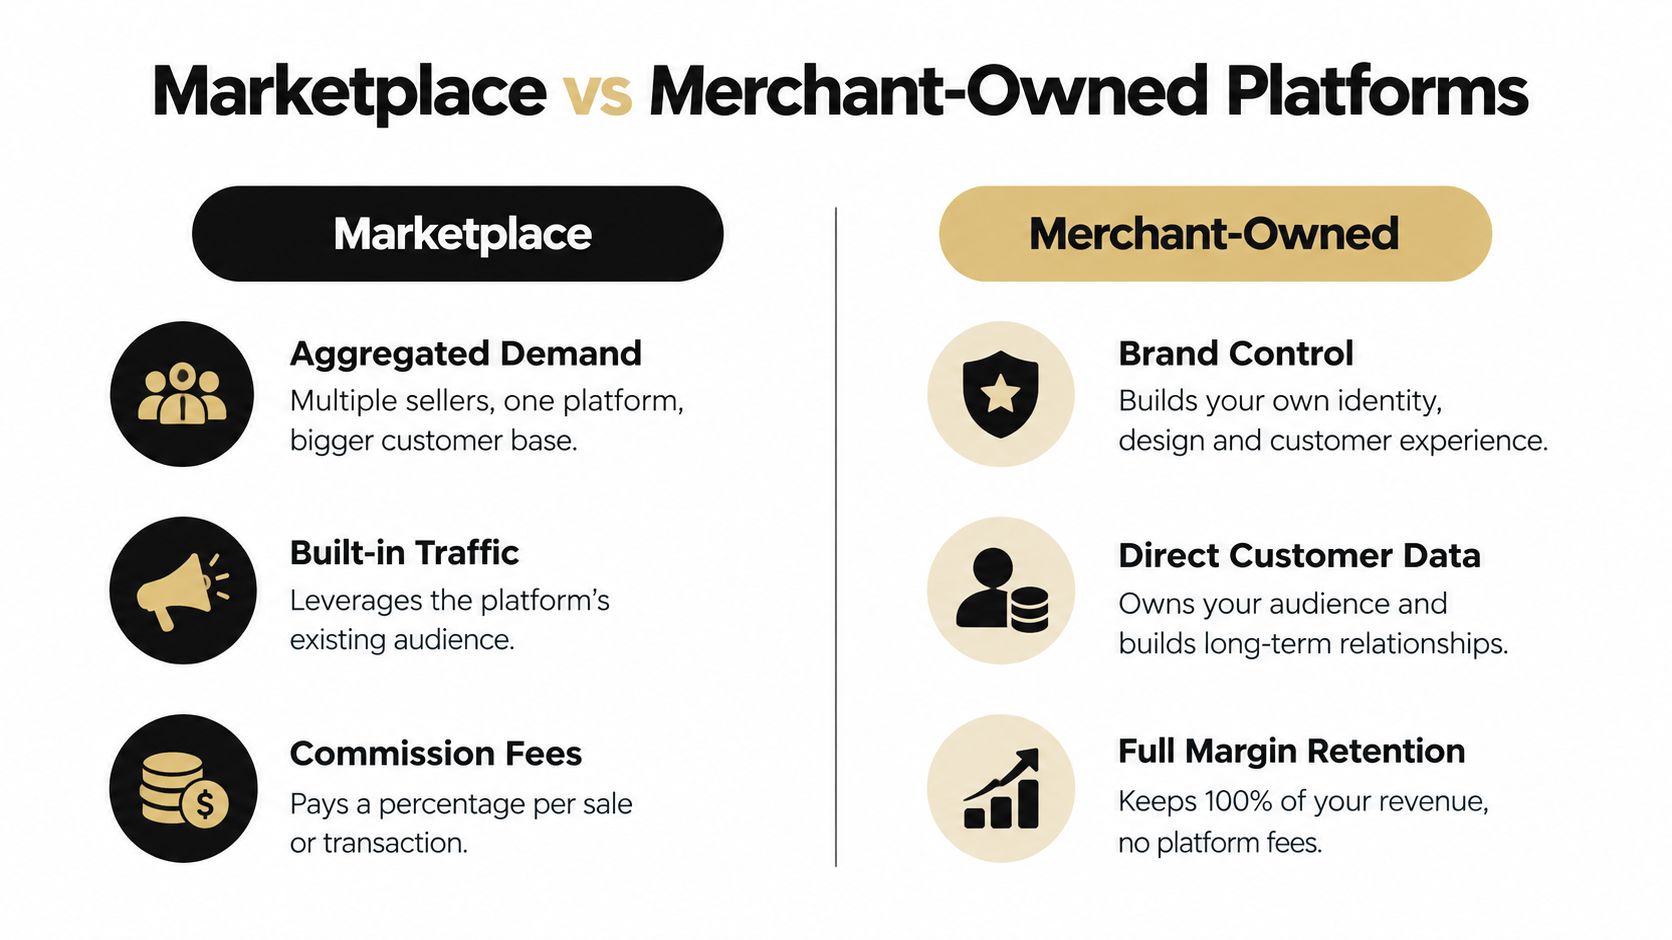
The visual below sets the two models side by side before we get into cost mechanics.
The Trade-Off in Practice
Marketplaces solve discovery. You get built-in traffic, established trust, and often fulfillment infrastructure you don't have to build. In exchange, you accept commissions, competing listings next to yours, limited control over checkout and presentation, and restricted access to customer data for lifecycle marketing. If the platform changes its ranking, fees, or policies, your margin moves with it.
Merchant-owned platforms invert that bargain. You keep brand presentation, customer data, pricing rules, and margin, and you can run subscriptions, POS, and B2B from one record. You also own the hard parts. You have to generate traffic, operate payments and fulfillment well, and maintain the stack. For teams weighing the economics directly, it's worth taking time to compare Shopify and Amazon costs from Arlo Inc. rather than comparing a subscription fee against a commission rate in isolation.
The useful question for a DTC brand isn't which model handles more volume globally. It's which balance of reach, control, extensibility, and data ownership fits your next stage, a distinction explored further in this breakdown of the direct-to-consumer platform model. Many brands end up hybrid, using marketplaces for discovery and an owned store for repeat purchase. That's fine, provided inventory, pricing, and customer records don't diverge between the two. Once they do, you've bought reach and paid for it in reconciliation work.
Evaluating Checkout Performance and Payments
Checkout is where platform comparisons get vague, and where the money is. Baymard's 2025 benchmark found that 64% of desktop ecommerce sites and 63% of mobile sites had mediocre or worse checkout UX, while only 2% of mobile sites rated good, and Baymard estimates the average large site could increase conversion by as much as 35% through checkout-design improvements alone, as reported in Baymard's 2025 checkout UX benchmark. That's not a niche usability problem. It's the default state of the industry.
That finding should change how you read a feature matrix. A platform can list more payment methods, more themes, and more integrations, and still lose buyers through clumsy address handling, poor wallet presentation, or slow tax and inventory calls behind a fast-looking storefront.
Storefront Speed Is Not Checkout Speed
An edge-served product page can load quickly while checkout stalls on inventory reservation, promotion logic, tax calculation, or a payment gateway timeout. You need to measure both, separately, with real users rather than vendor lab tests. A monitoring framework that identifies a typical ecommerce conversion baseline of roughly 2 to 3% also stresses correlating technical metrics with cart additions, checkout starts, payment attempts, and order confirmations, as set out in Cognativ's ecommerce performance monitoring framework.
Checkout Performance Metrics to Compare
| Metric | What It Measures | Why It Matters |
|---|---|---|
| Time to First Byte | How quickly the server starts responding | Slow starts compound through every later step |
| Largest Contentful Paint | When main content becomes visible | Buyers judge speed by what they see, not background loads |
| Interaction to Next Paint | Responsiveness to taps and typing | Laggy forms read as broken on mobile |
| Checkout API latency | Speed of cart, tax, and payment calls | Reveals dependencies hidden behind the storefront |
| Payment error rate | Failed or timed-out authorization attempts | Directly converts intent into lost orders |
| Checkout completion | Share of started checkouts that finish | The outcome metric the others should predict |
Ask vendors for median and p95 results segmented by geography, device, and cache state, plus wallet authorization success by method. If a vendor can't state its traffic and device assumptions, you don't have a benchmark. You have marketing.
Total Cost of Ownership Over Five Years
Headline subscription price is the least informative number in a platform deal. Benchmarking from Branvas puts fully loaded ecommerce technology cost at about 4 to 15% of revenue depending on merchant scale, with per-revenue cost generally falling as stores grow, in Branvas benchmarking of ecommerce technology costs as a share of revenue. A spread that wide means the license is only the visible part of the model.
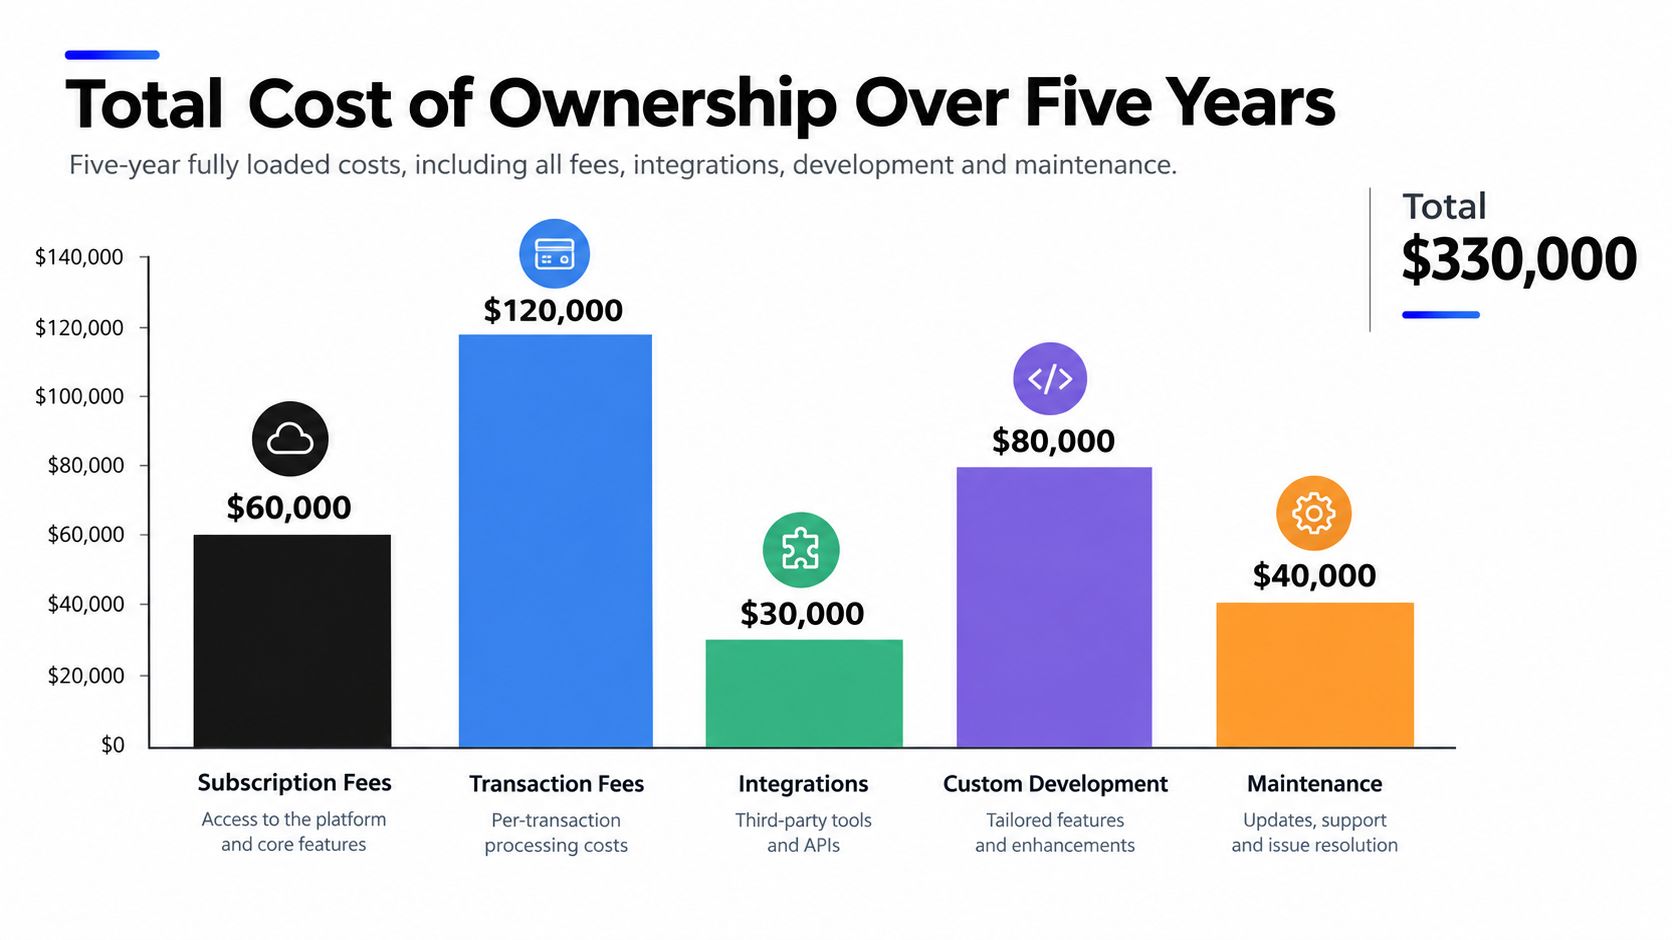
Price the system, not the storefront.
Build the five-year view as a stress test, not a quote comparison. Start with recurring cash outlay: platform fees, payment margin, support tiers, app renewals, and per-order charges. Then price the team around it: implementation, migration testing, developer maintenance, webhook repair, and incident recovery. The third line is operational exposure: downtime during peaks, oversells from stale inventory, and misattributed spend when data is fragmented.
Run that model at two GMV levels and one downside case. The platform that is cheaper at current volume can invert when payment margin, order fees, or app dependencies scale faster than revenue. Put a migration contingency beside the steady-state cost as well, because redirect mapping, catalog cleanup, and parallel-run labor are real even when they never appear in a proposal.
Practical rule: when cash cost is close, choose the stack with fewer duplicated systems. Reconciliation rarely appears in a quote, but your team pays it every week.
App consolidation changes the slope of the curve. Every tool a platform absorbs natively removes a vendor fee, a sync job, and a failure point; every gap you still need becomes all three. Before locking assumptions, line your model up against published pricing and plans so license cost, payment margin, and app substitution are judged in the same place.
Building a Weighted Scoring Framework
A weighted scorecard should reflect where platform performance affects revenue and operating workload. Equal weights can hide meaningful differences: a subscription-led brand and a wholesale retailer have different priorities, even if they assess the same platforms.
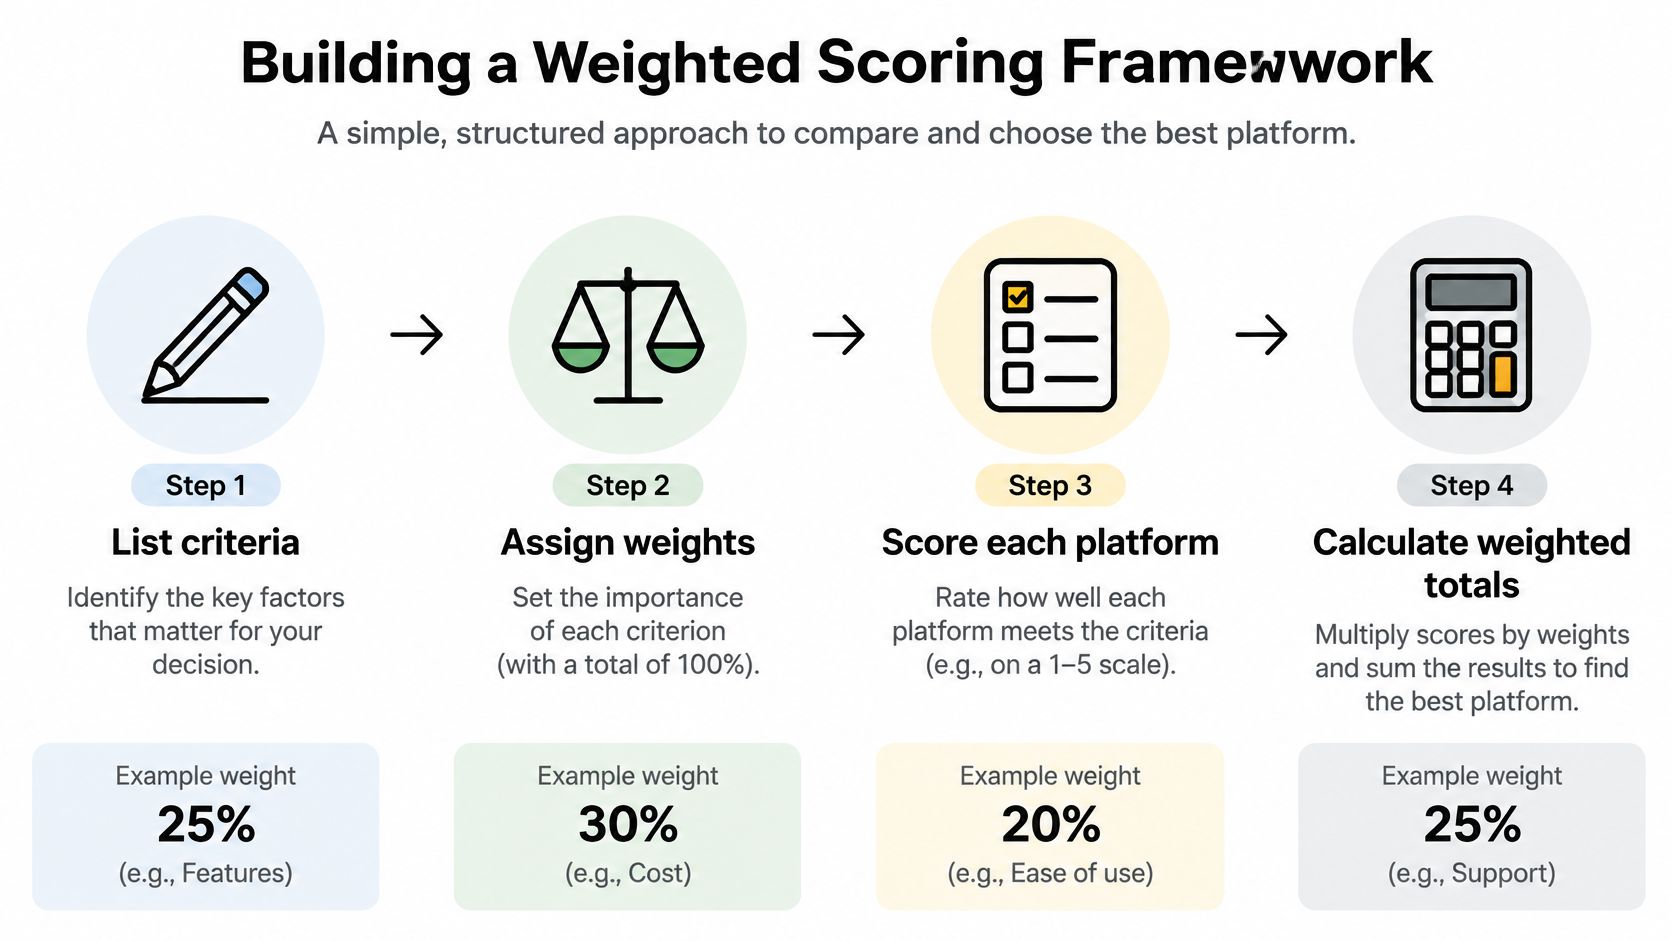
Set the weights before reviewing vendor scores. That helps prevent a polished demo from shifting the criteria after the fact. Then define the evidence each score requires: a repeatable checkout test, a reference call, or a working sandbox build.
Build the model around your order lifecycle. Relevant criteria may include checkout performance, subscriptions, payments, POS, B2B workflows, API behavior, and migration risk. Give each criterion weight according to its effect on revenue or execution. For a subscription business, for example, renewal handling within the main order lifecycle may matter more than theme-editor flexibility.
Keep capability and delivery risk as separate scores. A platform may support a required workflow, while the implementation still depends on custom development or fragile integrations. Record assumptions such as traffic mix, sales volume, regions, and payment methods so the team can update the assessment when those conditions change.
Test whether the ranking holds under pressure. Raise the weight of the two most important criteria, then check whether the preferred platform remains on top. If the result changes sharply, identify which trade-off drives the decision rather than relying on the total score alone.
For API behavior, look beyond integration counts. Assess write idempotency, webhook reliability, and the tools available to diagnose failures outside business hours. Score the alternatives consistently, including the strongest capabilities of the runner-up. Those gaps show what the chosen platform may require from custom development or operational work.
Matching Platforms to Brand Scenarios
Criteria become useful when you attach them to a real operating model. Consider three brands that would all describe themselves as DTC, and would all make a mistake by copying each other's shortlist.

Three Scenarios, Three Different Winners
A fast-growing skincare brand selling online, on subscription, and in its own retail space lives or dies on unified order records. Renewals have to sit in the same lifecycle as one-time orders, POS sales have to draw on the same inventory, and a customer's history can't split across three tools. For this brand, checkout performance and subscription depth dominate, and a consolidated system such as PlatformDTC, which combines storefront, checkout, subscriptions, payments, POS, and B2B on one catalog and order record, belongs on the shortlist alongside other unified options.
A heritage furniture maker with a wholesale arm has the opposite center of gravity. It needs B2B draft orders, invoicing, and wholesale pricing that don't fight the consumer storefront, plus catalog handling for complex, low-velocity products. Storefront polish matters less than whether a trade customer can reorder without emailing a rep. Teams at this end of the market often cross-check enterprise options using Quikly's enterprise platform guide from Quikly to understand how established enterprise platforms handle that depth.
The third brand isn't chasing a feature at all. An artisanal food business running a fragmented app stack is losing time to data drift, where inventory, discounts, and attribution disagree between systems. Its dominant criterion is consolidation. Warning signs of a mismatch are consistent across all three. Strong storefront tools paired with weak renewal handling, capable POS with shallow B2B workflows, or impressive demos with no answer on inventory reservation accuracy all predict pain that a feature checklist won't surface.
Migration Risk and Parallel-Run Tactics
A migration can pass its launch date and still fail operationally. Orders may arrive while inventory counts diverge, subscription renewals may lose payment or consent records, and customer support may have no reliable view of the transition. Classy Llama's 2025 research on replatforming priorities and migration challenges identifies data security as a leading migration challenge. For a DTC brand, the practical test is whether records remain accurate and customers can keep ordering throughout the change.
Run the old and new systems in parallel long enough to test the workflows that carry revenue. Start with internal traffic and controlled orders; expand only after the teams responsible for fulfillment, finance, and support can reconcile results. A checklist alone will not catch timing conflicts, so compare records across systems after each test.
Set explicit pass conditions before cutover:
- Product, variant, pricing, and inventory records match between platforms.
- Test orders reach fulfillment with correct payment, tax, discount, and shipping details.
- Subscription renewals preserve payment methods, consent records, and billing schedules.
- Rollback procedures account for orders created during the transition, including how those orders are reconciled.
- The new platform handles expected operational load without unexplained changes to inventory or order data.
Choose the cutover window around operational risk, not just low site traffic. A quiet period can still coincide with a renewal batch, a warehouse deadline, or a promotion setup. Assign a migration owner with authority to pause the rollout, and track failed payments, order exceptions, inventory discrepancies, and support contacts against agreed thresholds.
Integration labor and data reconciliation can outweigh software savings if teams discover them after launch. Include those costs in the five-year comparison, and budget time for staff training and post-cutover checks.
If automation or AI agents will change merchandising, campaigns, or operations, define their permissions before they receive write access. Limit access by role, require approval for spending changes, make repeated writes safe to retry, and retain an audit trail. For sequencing, testing, and rollback guidance, see this operational guide to ecommerce platform migration. Treat the transition as a product launch, with an owner, a budget, and measurable acceptance criteria.
Frequently Asked Questions About Platform Selection
Is a Platform With More Features Automatically Better
No. Feature counts mislead when checkout implementation and data consistency are weak. A longer capability list spread across disconnected apps usually means more sync failures and more reconciliation, not more revenue. Score outcomes first, then check whether the features you need are native to one order lifecycle.
Why Can a Fast Storefront Still Lose Sales
Because storefront speed and checkout speed are different systems. Product pages can be served from the edge while checkout waits on inventory, tax, promotion, or payment dependencies. If you only benchmark the storefront, you'll approve a platform that looks fast and converts poorly.
Should Migration Risk Stop You From Switching
Not by itself. Staying put has its own compounding cost in labor and drift. The safer comparison isn't switch versus stay, it's parallel run versus big-bang cutover. Running both stacks until the new one proves stable converts an irreversible gamble into a managed transition.
If you're consolidating a fragmented stack or evaluating your next platform, PlatformDTC brings storefront, edge-served checkout, subscriptions, payments, POS, B2B, and analytics onto a single order record, with governed APIs and parallel-run migration support built in. Visit the site to compare your current stack against a unified model and see what your five-year costs and checkout performance could look like.