Analytics and reporting

Make smart business decisions, quickly

Real-time and reliable data about your store, no set-up required
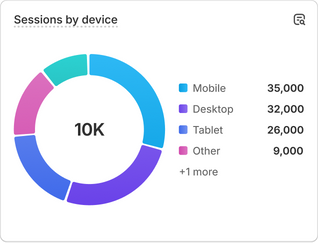
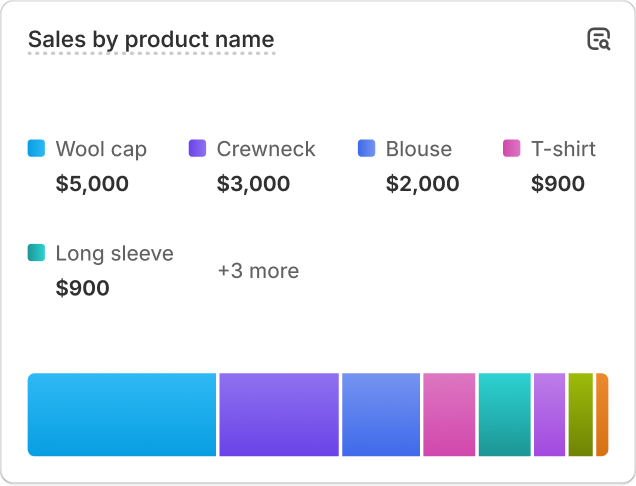
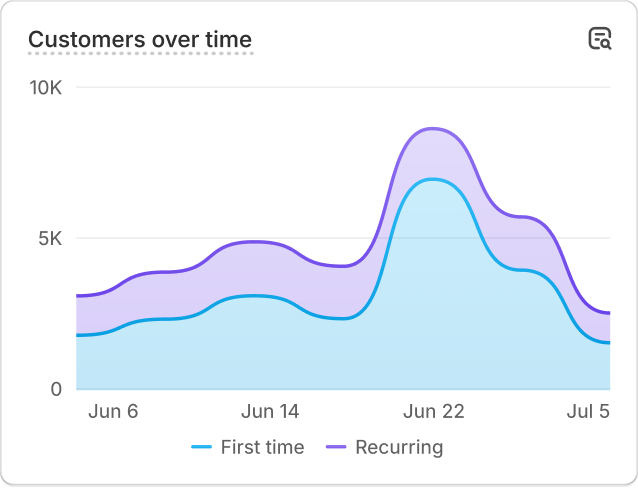
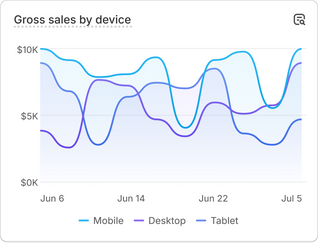
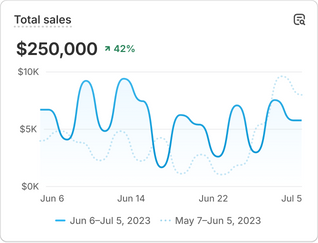
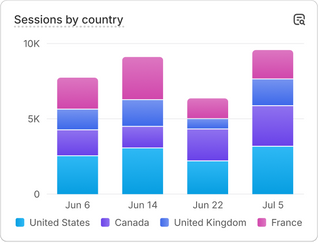
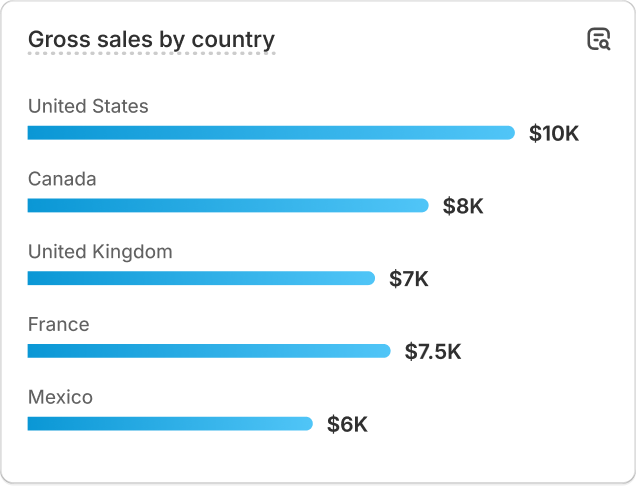
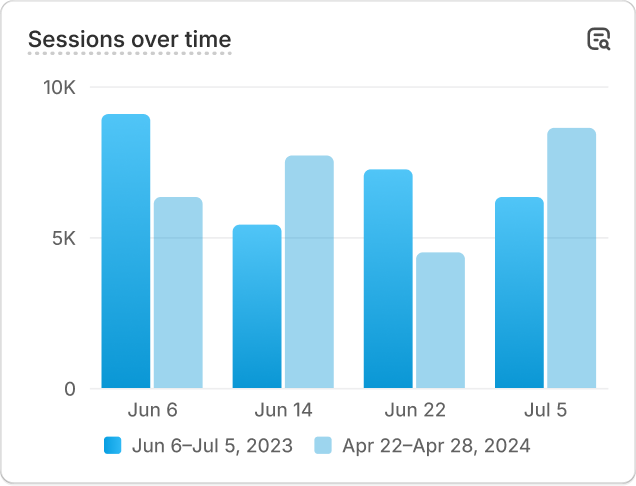
A chart with sales performance data that reads 'Sessions by device'.A chart with sales performance data that reads 'Customers over time'.A chart with sales performance data that reads 'Total sales'.A chart with sales performance data that reads 'Gross sales by country'.A chart with sales performance data that reads 'Sales by product name'.A chart with sales performance data that reads 'Gross sales by device'.A chart with sales performance data that reads 'Sessions by country'.A chart with sales performance data that reads 'Sessions over time'.

Fast, flexible, and relevant reporting

Pre-built reports for commerce

Access PlatformDTC-built reports that are designed for commerce insights. Immediately understand your store’s performance with no additional work required, so you can respond faster and make optimizations.
See reports

Deeper data exploration

Modify pre-built reports or create your own from scratch to answer questions specific to your business. Layer on additional metrics and dimensions to drill down deeper into your reporting, and hone in on the exact data you’re looking for.
Start exploring

Real-time monitoring

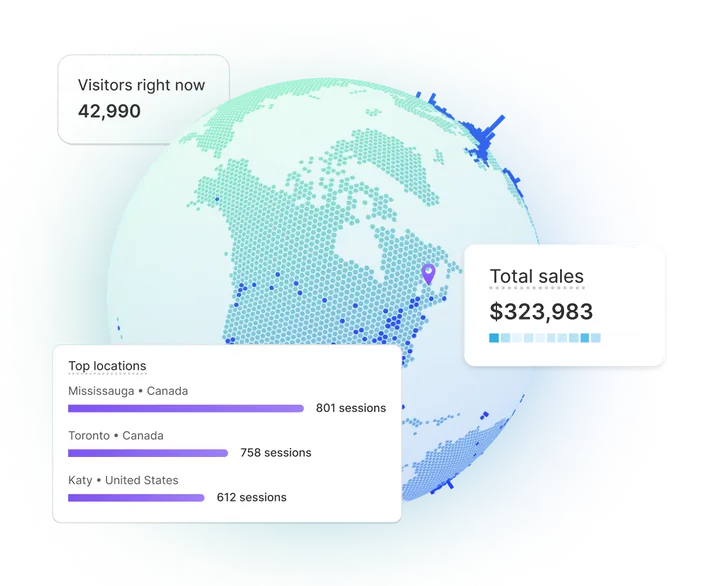
Never miss a change in your store’s performance with real-time data updates in your dashboard and across all reports. Drag, drop, and tailor your dashboard to see your most critical metrics at a glance, and make timely decisions in response to changes in your data.
View your dashboard

Check all of your essential analytics in one place

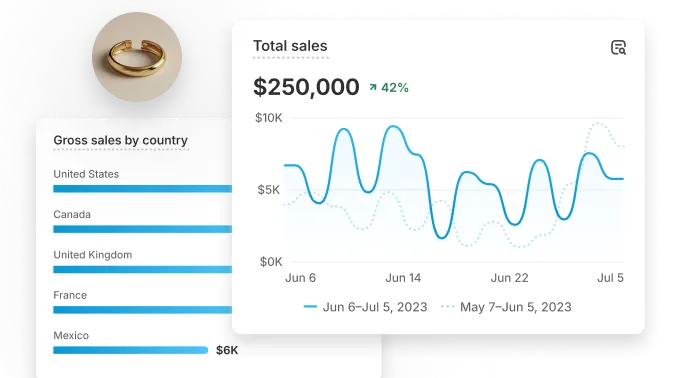
Collage with a piece of jewelry and a bar graph with gross sales by country, overlaid by a total sales line graph by month.

Sales

Know how much money your store is making across channels.
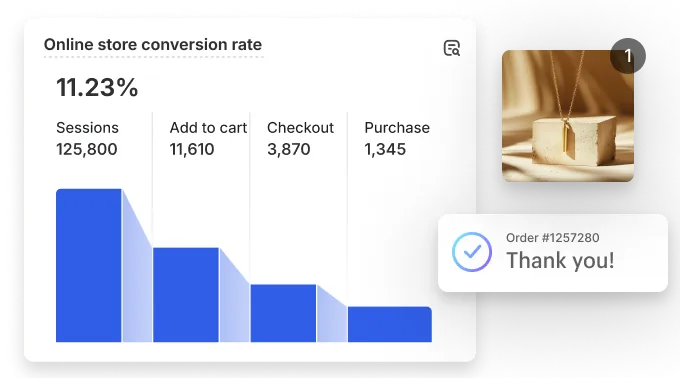
Collage with a graph of online store conversion rate, overlaid with a piece of jewelry and an order pop-up that says “Thank you!”

Conversion rate

Understand what it takes for site visitors to become customers.
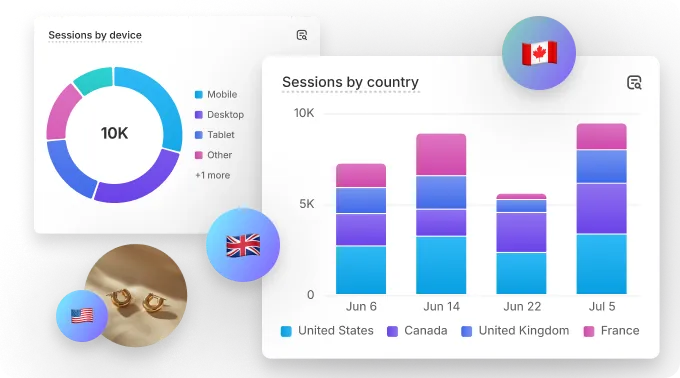
Collage with circle graph of sessions by device overlaid by a sessions by country bar graph, with small images of Canada, U.K., and U.S. flags.

Sessions

See the site traffic your store is getting, and where your visitors come from.
Go to your dashboard
Clothing item and two graphs: one line chart showing sales attributed to marketing, and a second with top marketing channels like Google, TikTok, etc.

Marketing measurement

Manage your multichannel marketing by organizing marketing activities like email, social, ads, and organic traffic into Campaigns and auto-generate shareable links and QR codes that attribute traffic and sales into the right Campaigns. Use channel marketing reports to better understand top channels, attribution, customer acquisition cost, return on ad spend.

Measurement that scales with your business

Connect to your data

Access your data wherever you need it through our API or connect to analytics integrations available in our app store.

Write custom queries

Query your data using a built-in query editor and PlatformDTCQL, our query language designed for commerce, available in every report. Can’t or prefer not to code? Have Sidekick, PlatformDTC’s AI assistant, write the queries for you.

Access more apps

Tap into PlatformDTC’s ecosystem of apps and partners to meet all your supplemental data and measurement needs.
Collage of gold earrings, Google and Meta app logos, and a computer pop-up window featuring raw data to connect API.

Start measuring with PlatformDTC today

Try PlatformDTC for free, and explore all the tools and services you need to start, run, and grow your business.