
Mastercard's 2025 subscription-economy research puts average monthly churn at roughly 20%, and 54% of the businesses it surveyed said more than 20% of their churn was involuntary (Mastercard's 2025 subscription-economy research). The same report found that more than half of U.S. businesses carry at least 10% of their subscribers as inactive. Put those together and a large share of the churn you report upward never involved a customer deciding anything at all.
A signup-month retention curve can't separate them. It counts the subscriber who cancelled over price and the subscriber whose card expired in the same column, then hands the total to one team. This guide pulls them apart, because a voluntary cancel, a failed payment, a paying-but-inactive subscriber, and a paused customer who returns next quarter each call for a different decision.
Table of Contents
- Why a Single Retention Curve Misleads
- How Signup Month Plan and Payment Define a Cohort
- The Metrics a Cohort Review Should Show
- How to Read Retention Across Months
- What Published Cohort Benchmarks Actually Show
- Matching Each Churn Pattern to a Fix
- Run the Next Cohort Review on One Record
Why a Single Retention Curve Misleads
A term ends and twelve students are missing from the register. Some walked out, some were locked out when their fees didn't clear, and some are still enrolled and asleep at the back of the room. Report them as one absence figure and you've described none of them well enough to act on.
A blended retention curve does exactly that to subscribers. Everyone not paying this month lands in the same count, whether they chose to leave over price, lost a card to a bank reissue, hit an issuer block, or stopped ordering eight months ago while the billing kept running. The percentage is precise and silent about cause.
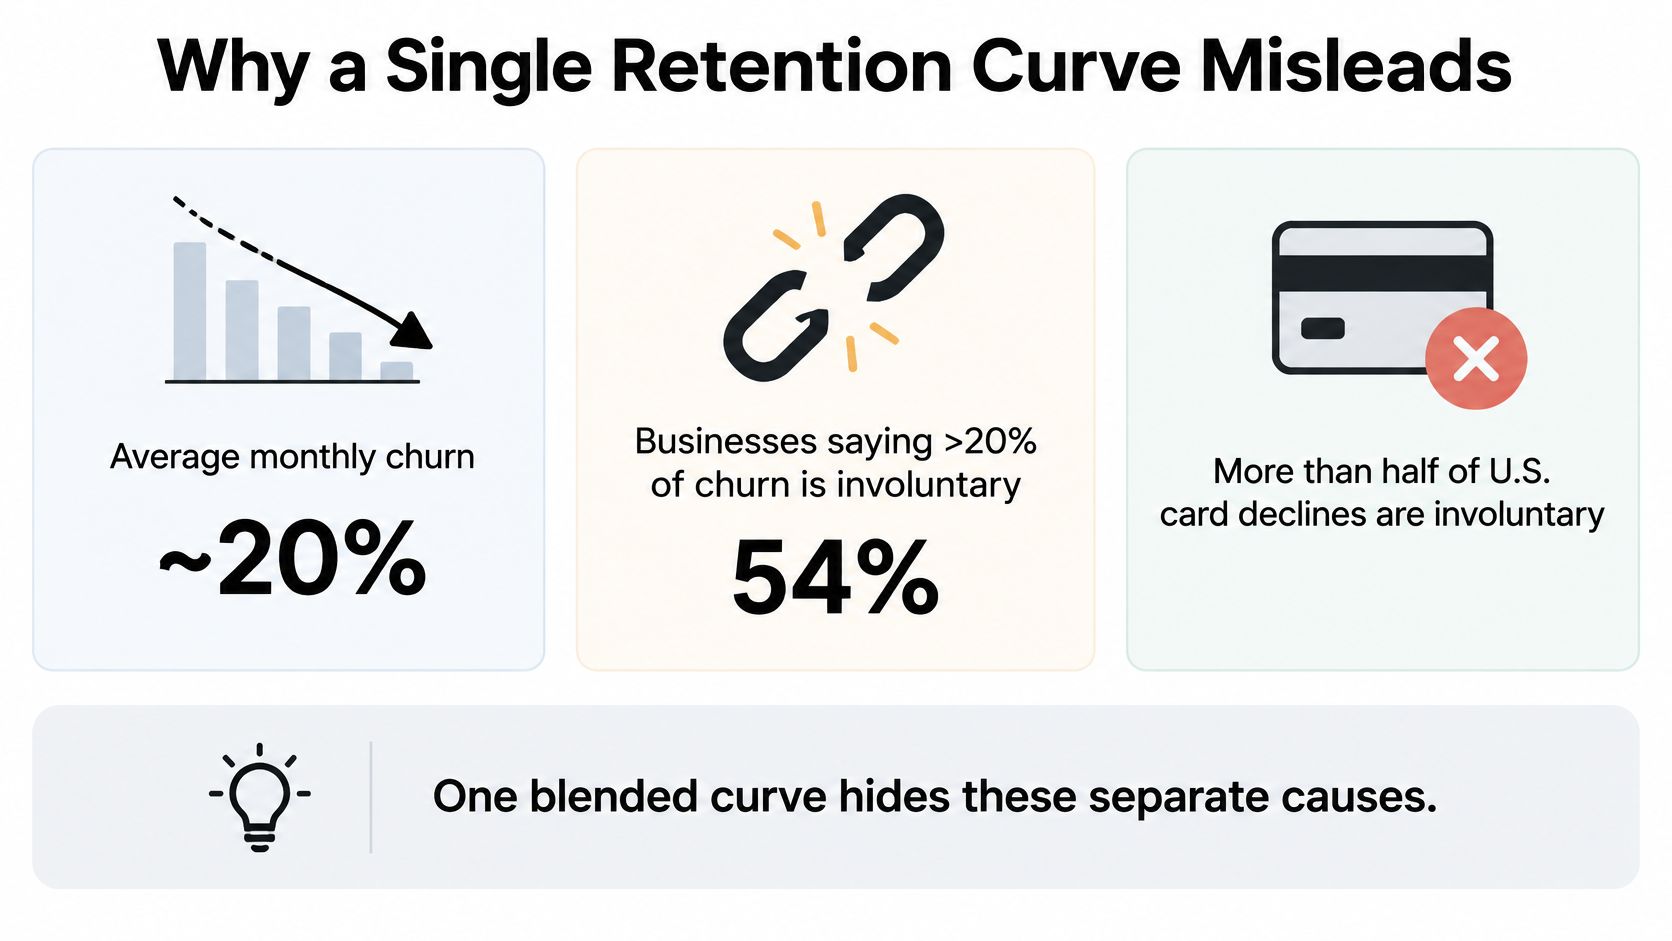
The cost of that silence shows up as misplaced work. A product team ships a feature to fix a problem that was really dunning. A finance team approves a discount to recover customers an expired card already removed. Both feel like retention work, and both spend the quarter in the wrong place.
A retention curve is a symptom list, not a diagnosis.
Treat it that way and the first question changes. You're no longer asking how many subscribers a cohort has lost. You're asking which of four things happened to each missing one, and who should own the response.
- Name the cohort. Signup month, plan and price tier, payment method, tenure band.
- Pick the definition that fits the decision. Logo, revenue, voluntary, involuntary, or pause-adjusted.
- Match the shape to a lifecycle action. Onboarding, dunning, engagement, or a pause policy.
The sequence behind those three steps is short. Group people by a shared start, measure more than one outcome for each group, read the grid month by month, then choose the intervention the pattern earns.
How Signup Month Plan and Payment Define a Cohort
Start with the anchor, not the chart. The default grain is signup month, meaning the calendar month of a subscriber's first successful paid subscription charge. Not the day they created an account, not the day a free trial began. The first charge is the moment the customer paid for a promise and the business took on an obligation, and every later column gets measured against it.
The diagram below shows how one pool of first paid orders splits into groups you can compare.
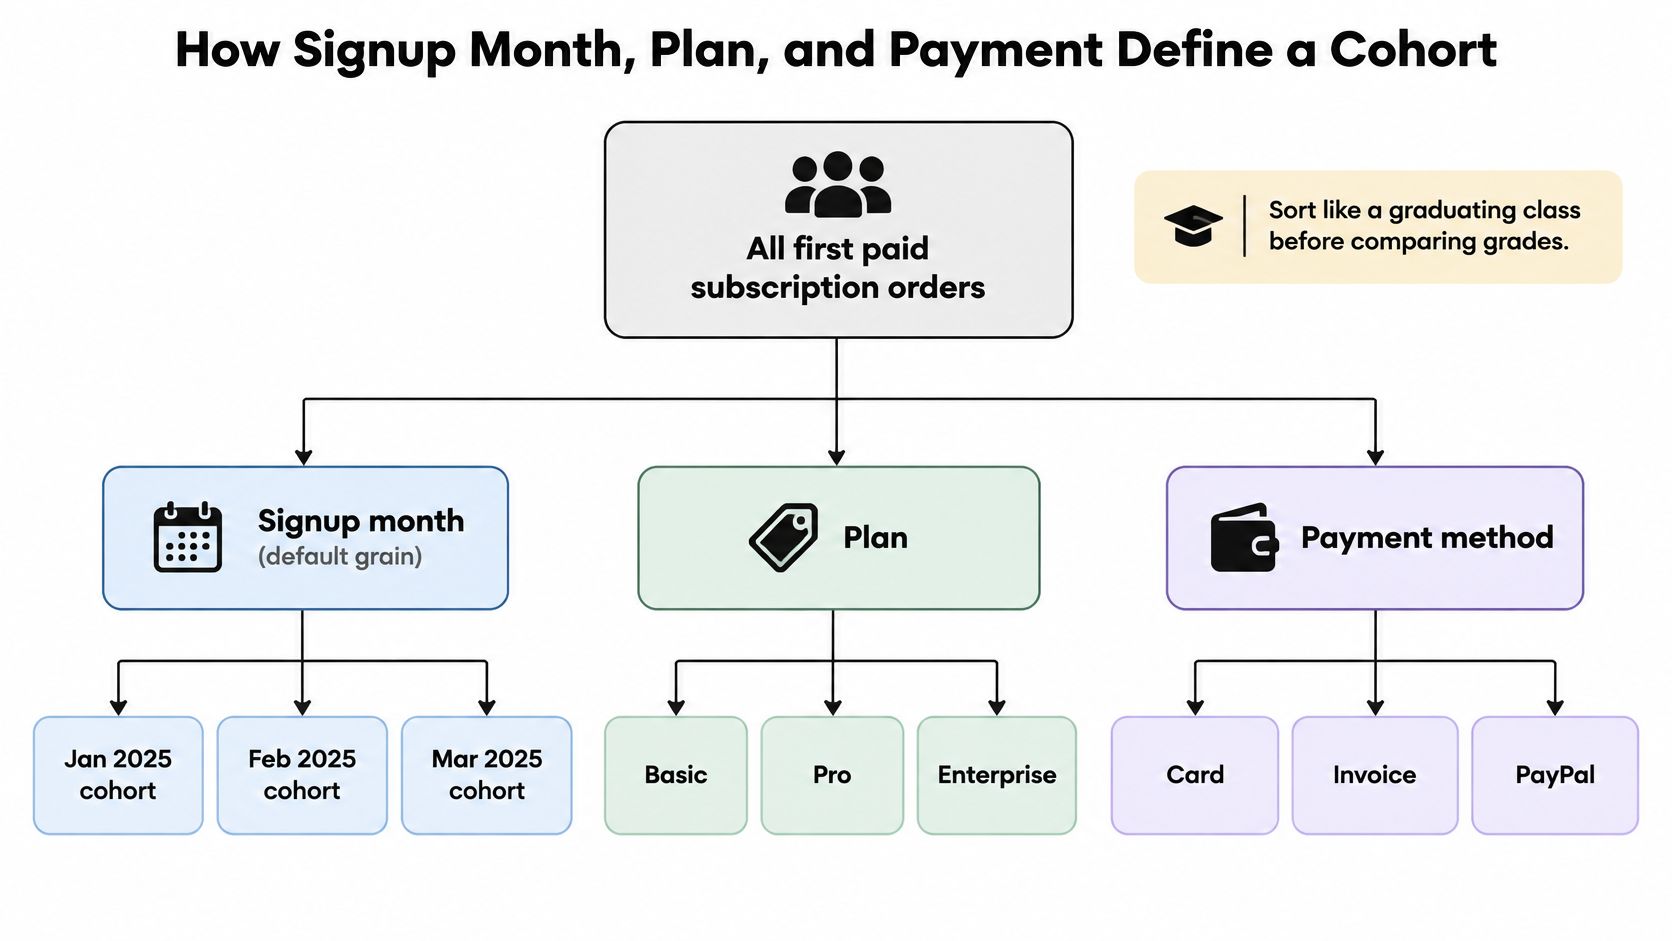
For a single product on a single plan with one cadence, that one cut is enough. Add dimensions only when the added view can change a decision.
When the default grain isn't enough
Five cuts earn their keep, and each one changes how renewals fail or how long customers stay.
- Plan and price tier. An intro-rate monthly buyer converting to full price and an annual full-price buyer don't share a curve. Blend them and the average describes neither.
- Payment method. Cards fail on expiry, reissue and issuer block. Invoices fail on approval cycles and accounts payable. Wallets fail on their own schedule.
- Geography. Issuer rules, tax treatment and card penetration shift decline rates by market.
- Tenure band. Month one is onboarding behavior. Month twelve is habit, or the absence of it.
- Acquisition source, only when identity is stable. Useful for comparing a paid channel against organic, not for rebuilding rows every time an ad platform renames a campaign.
Then set the clock. Month zero is the month of the first successful charge, and every later column is a billing anniversary, not a calendar month. A subscriber who started on 31 January and one who started on 2 February don't belong in the same renewal week, and forcing them together manufactures noise that looks like a trend.
Write the membership rules down once and apply them every month. An upgrade stays in the original cohort with the extra revenue flagged as expansion. A pause stays in and gets flagged, never deleted. A failed renewal stays in until the dunning window closes, then moves to involuntary churn if it wasn't recovered. A one-time add-on attaches to the subscriber and never creates a new cohort.
If you'd rather watch this part than read it, the walkthrough below covers cohort construction at the same level of detail.
Five checks before you trust the chart
Run these before anything goes on a slide.
- Same start event. Every row begins at first successful charge, not at signup.
- Same currency. Convert once, at the rate you'll use in the P&L.
- Same voluntary and involuntary flag. One rule for what counts as chosen.
- Same pause rule. Paused counted in or out, and stated on the chart.
- No double counting. A reactivated subscriber returns to the old cohort. They don't arrive as a new logo.
Build the join before you build the grid. Billing events, subscription status, product usage, support tickets and any exit survey need to resolve to one customer identity, or you can compute a total and nothing else. A subscriber record that carries plan, payment method, decline reason and usage history is what makes the voluntary-versus-involuntary split possible at all.
The Metrics a Cohort Review Should Show
Copy the scorecard before anyone argues about method. Eight rows, each one answering a decision a real person has to make.
| Metric | What it counts | A drop usually means | First response |
|---|---|---|---|
| Logo retention | Share of the starting subscribers still entitled | Customers left the plan | Check month of cancel before changing price |
| Gross revenue retention | Renewal revenue versus starting subscription revenue, no expansion | Downgrades, skips, or lost renewals | Compare plan mix inside the cohort |
| Net revenue retention | Renewal revenue plus upgrades and added quantity | Expansion no longer covers losses | Separate upsell from churn before celebrating NRR |
| Voluntary churn | Cancels the customer chose | Dissatisfaction, price, or fit | Save offer or product change |
| Involuntary churn | Failed payment, expired card, or payment block | Billing failure, not preference | Retry, card update, and dunning |
| Inactive subscribers | Still paying but not using or ordering | Future cancel risk | Usage or replenishment message |
| Pause-adjusted retention | Paused subscribers kept in the base | Timing change, not permanent loss | Judge pause length before calling it churn |
| Reactivation rate | Returned after cancel or pause and paid again | Demand was recoverable | Win-back only if later order value holds |
Logo retention and gross revenue retention are the base pair. Logo retention counts subscribers still entitled at month N as a share of the starting group, so it moves when customers leave the plan. Gross revenue retention compares renewal revenue with starting subscription revenue and deliberately excludes expansion, which is why it catches the downgrade, the skipped order and the lost renewal that a headcount cannot see. When the two diverge, compare plan mix inside the cohort before you touch price.
Net revenue retention adds upgrades and added quantity back in. A cohort can lose subscribers and still hold or grow revenue, and that is a genuine result worth knowing. It is also the easiest number in the set to celebrate by accident. A cohort that lost a third of its members can post a strong NRR if a few survivors upgraded, so split upsell from churn before drawing conclusions.
Voluntary churn is a cancel the customer chose. Involuntary churn is a failed payment, an expired card or an issuer block. When both land in one column, the total goes to a single owner and the wrong fix gets assigned: a merchant losing renewals to expired cards hears "churn" and rewrites the onboarding emails instead of the retry schedule.
The voluntary-versus-involuntary split is the row pair that changes what the review decides.
Inactive subscribers keep paying and stop using or ordering, so they are a usage problem before they are a cancel problem. Pause-adjusted retention keeps paused subscribers in the base so a timing change does not read as permanent loss. Reactivation rate counts the ones who came back and paid again, which tells you whether demand was recoverable or gone for good.
The formulas behind the rows
- Logo retention = subscribers still entitled at month N ÷ starting subscribers
- Gross revenue retention = cohort renewal revenue at month N ÷ starting subscription revenue, expansion excluded
- Net revenue retention = (renewal revenue + upgrades + added quantity) ÷ starting subscription revenue
- Pause-adjusted retention = (entitled + paused subscribers) ÷ starting subscribers
- Reactivation rate = subscribers who returned and paid again ÷ subscribers who cancelled or paused
- Voluntary share = voluntary cancels ÷ all churn events in the cohort
The case for counting pause as its own row deserves a place in the scorecard. Pause options are becoming a standard part of subscription management, and a cohort with weaker uninterrupted retention can still produce more lifetime revenue if the pause replaced a cancel and the customer reactivated later with a bigger order. Reading that properly means comparing cohorts on successful renewals, pause duration, reactivation rate and order value after return, rather than on one binary active-or-cancelled metric.
Report at least logo, revenue, voluntary, involuntary and pause-adjusted views on the same cohort. One blended curve is a decision made on a fifth of the evidence. A shorter working version of this scorecard lives in the subscription metrics to track checklist.
How to Read Retention Across Months
The grid puts cohorts down the rows and months since start across the columns. Each cell holds the share of the original group still active under whichever definition you picked.
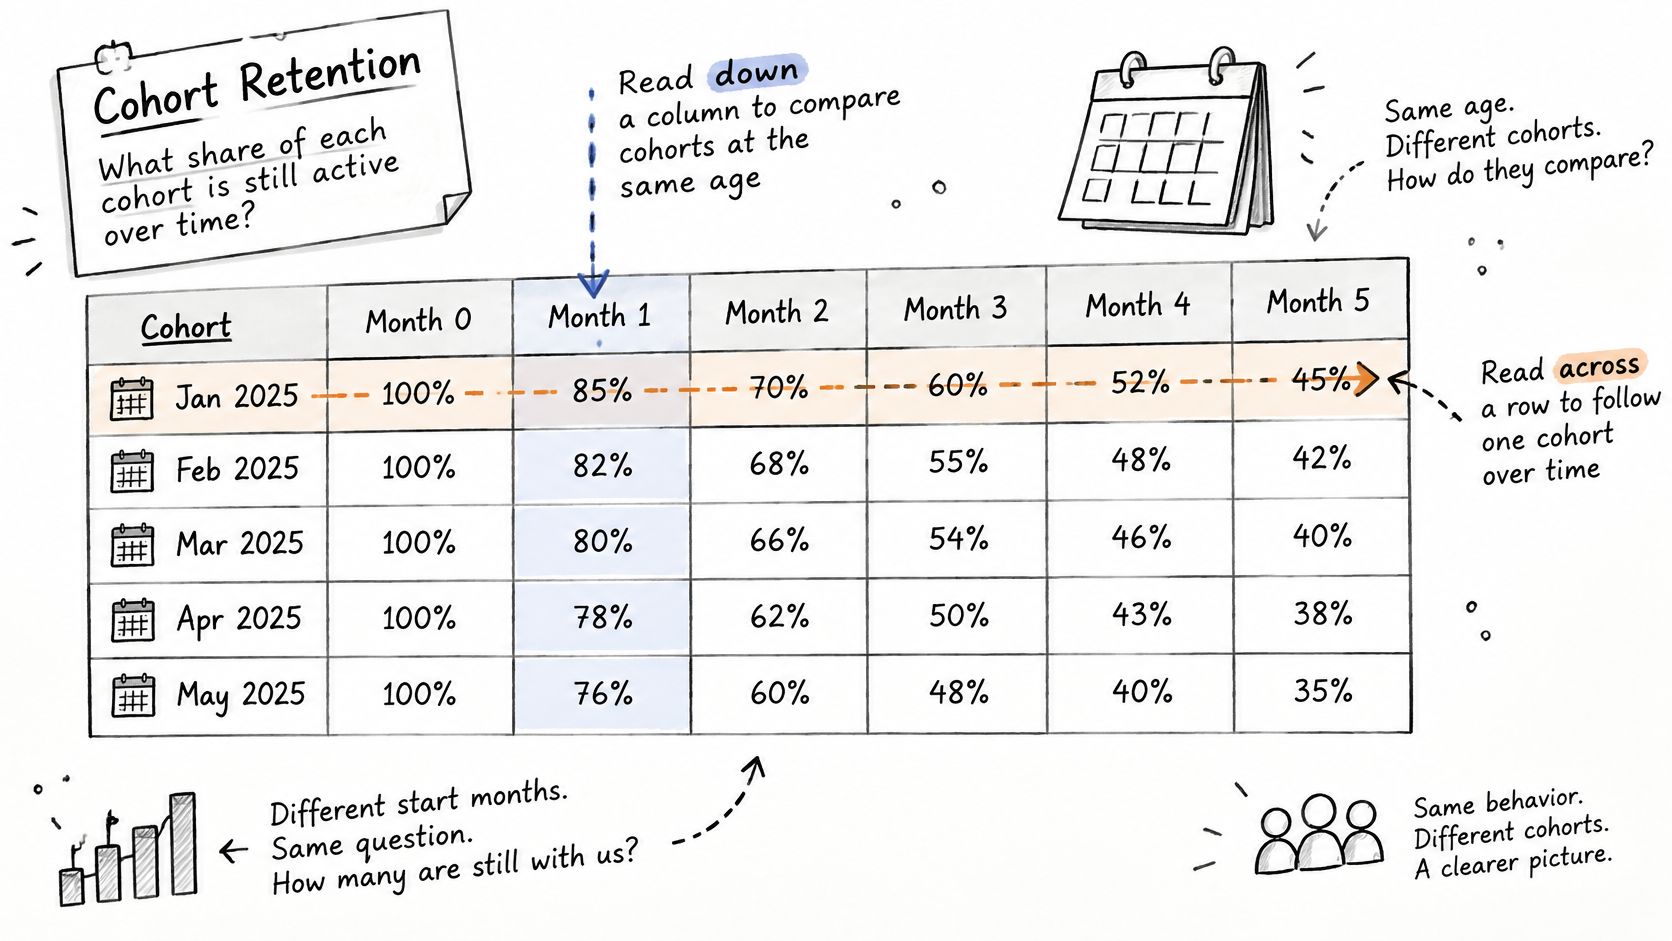
Read it in two directions, because they answer different questions. Down a column compares cohorts at the same age, so a January cohort and a March cohort are judged at month three on equal footing. Across a row follows one cohort as it ages, which is where you see the relationship weaken.
Three shapes worth naming
A month-one cliff. The first renewal or the end of an introductory rate failed. Something in the first cycle broke: the welcome sequence, the first delivery, the checkout promise, or a price step-up nobody explained.
A slow slide through months two to six. Value faded rather than snapped. Habit didn't form, or the product became routine and the reminder emails started reading like invoices.
A late drop near month twelve. That usually lines up with an annual renewal, a scheduled price increase, or a card that expired between charges.
Two cautions before you compare anything. The newest cohort has empty cells on the right, so its month-one rate can't be set against an older cohort's month twelve. And a cohort of a few dozen subscribers swings hard on a single cancel, so pair every percentage with the starting count it came from.
Separate the revenue rows from the logo rows at the same ages. A logo dip with flat revenue can be a downgrade moving customers into a cheaper tier, while flat logos with falling revenue often means skipped orders or a discount running through the base.
If January's cohort holds 74% of logos at month three and March's holds 58% at the same age, the change sits in acquisition or in the first-renewal experience. It isn't a problem that appears at month twelve, and reworking annual renewal won't touch it.
Annotate the grid. Mark offer changes, price changes, packaging edits, carrier incidents and payment-provider outages on the chart itself. A cliff with a date and a cause becomes a decision. A cliff without one becomes another meeting.
What Published Cohort Benchmarks Actually Show
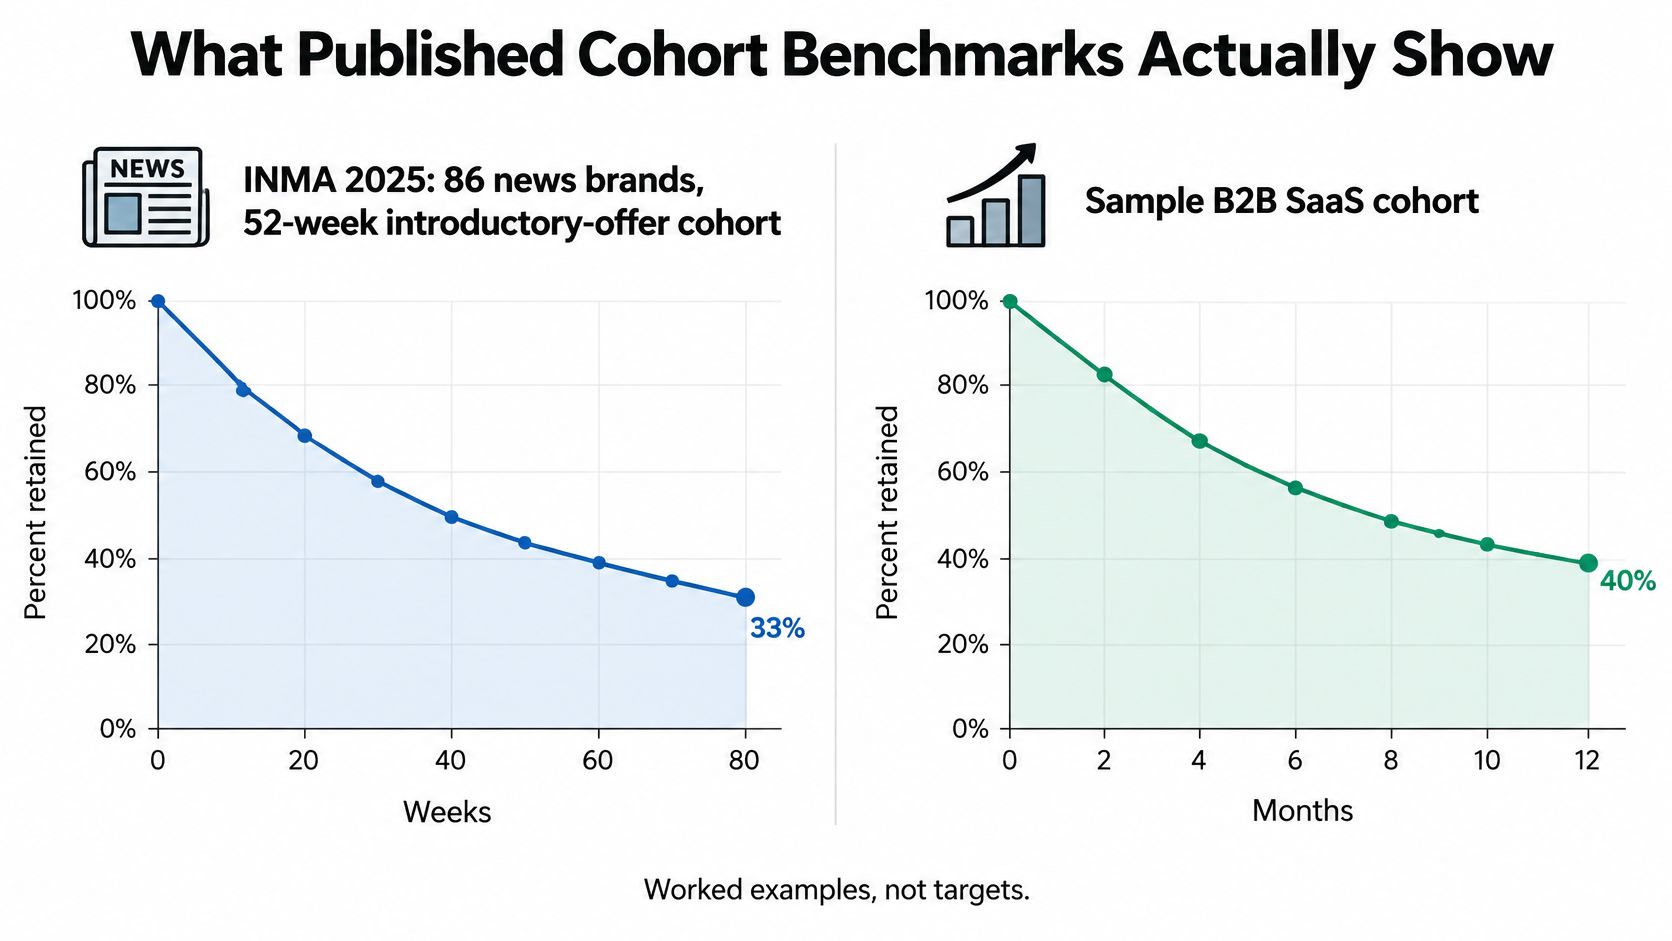
Two published results are worth calibrating against, as long as you read what each one measured.
INMA's analysis of subscriber, revenue and retention data from 86 news brands found that the 52-week introductory-offer cohort retained approximately 33% of subscribers at week 80 (INMA's 2025 promotional offer benchmarks). Week 52 closes the introductory year, so week 80 sits roughly seven months past that first full-price renewal. That is a long-tenure figure; it says little about month three. It also pools chosen cancels, failed cards and paused readers into a single retained-or-not count.
RevenueCat's State of Subscription Apps 2024 reports a 13.7% decline in year-one retention for monthly subscription apps. Read that as a change in the curve rather than the curve itself. Renewal cadence does much of the remaining work: a monthly plan renews twelve times inside the window where an annual news offer renews once, so identical logo loss compounds at a completely different speed. Twelve renewal dates give churn twelve opportunities. One gives it one.
The same cohort, four counting rules
Take a fictional DTC subscription: 1,000 subscribers who started in January, 180 voluntary cancels by month twelve, 90 failed payments of which 40 were recovered, and 70 pauses of which 25 later reactivated and placed another paid order. Nothing about these customers changes. Only the counting rule does.
| Counting rule | Subscribers lost | Logo retention |
|---|---|---|
| Pauses active, recovered failures kept | 180 + 50 = 230 | 77% |
| Pauses treated as churn, recovered failures kept | 180 + 50 + 70 = 300 | 70% |
| Pauses active, all failures lost | 180 + 90 = 270 | 73% |
| Pauses treated as churn, all failures lost | 180 + 90 + 70 = 340 | 66% |
Counting only the 50 unrecovered failures as lost gives 77% logo retention with pauses still active, and 70% once pauses count as churn. Booking all 90 failures as lost moves those readings to 73% and 66%. The spread between the best and worst reading is eleven points, and every one of them is definitional.
Revenue can move the other way. If those 25 reactivated customers return for a larger bundle, the cohort that looks weakest on a strict logo line can be the one paying best by month fifteen. A benchmark sets a range; the split inside your own cohort sets the action. For a comparison band to argue against, these subscription churn rate benchmarks sort by plan type and cadence rather than blending everything together.
Matching Each Churn Pattern to a Fix
Signup-month charts leave one question open, and it decides where the budget goes: did the customer leave because the product or price stopped fitting, or because a failed payment, expired card or payment block removed them from the billing file? Those paths have different owners and different fixes, and no single curve separates them.
| Pattern | Confirming evidence | Decision |
|---|---|---|
| Early voluntary exit | High month-one cancels and low usage before cancel | Fix onboarding or the plan sold at checkout |
| Payment failure | Involuntary share large versus chosen cancels | Retry and card update, not a discount |
| Pause instead of cancel | Lower strict retention but strong reactivation and later order value | Keep pause and measure return value |
| Renewal or price cliff | Drop lines up with month 12 or a known price step | Pre-renewal message for that tenure only |
| Inactive but paying | Subscribers billed with no orders or usage | Engagement before a save offer |
An early voluntary spike, with heavy month-one cancels and thin usage beforehand, points at onboarding and expectation setting, or at the plan someone was talked into at checkout. The fix belongs with the offer and the first experience, not with the billing team.
A payment-failure spike is a billing problem wearing a retention costume. When involuntary churn sits well above chosen cancels, the work is retries, card-updater messages and a dunning path that reads the decline reason rather than applying a blanket discount to everyone who declines.
A pause-heavy cohort with solid reactivation and healthy later order value is in better shape than the strict line suggests. Keep the pause option and measure what returning customers spend. Removing flexibility to make a chart look cleaner is a decision that costs revenue.
A cliff at a known renewal or price step is a tenure problem with a narrow fix. Send a reminder before the charge and test an annual alternative for that age band only. A large inactive-but-paying group is a usage problem first, so engage those subscribers before offering to save them from a cancel they haven't attempted.
Common misallocation: a cancellation offer sent to a declined card, a product feature built to fix dunning, and a recovered payment booked as a brand-new cohort.
Run the monthly review in a fixed order so the loudest chart doesn't set the agenda.
- Involuntary share. Fastest to fix, easiest to miss.
- Month-one voluntary cancels. Cheapest to prevent.
- Pause duration and reactivation value. Decides whether flexibility earns its place.
- The oldest cohort's renewal cliff. Slowest signal, longest lead time.
When involuntary churn tops that list, the playbook for reducing involuntary churn goes deeper on decline reasons and retry timing than a cohort review can.
Run the Next Cohort Review on One Record
Pick one signup month, usually the latest that has passed its third renewal, and export five numbers: logo retention, gross revenue retention, voluntary cancels, unrecovered failed payments, and pause-adjusted retention with reactivation rate. Five numbers, one cohort, once a month.
Then read them against decision rules instead of vibes.
- If involuntary churn dominates, the next build is payment recovery, not a save campaign.
- If month-one voluntary cancels dominate, the next build is the offer and the first ninety minutes of the experience.
- If paused customers return with healthy order value, keep the flexibility and stop scoring them as lost in board reporting.
That routine fails for a mundane reason. When billing events, subscription status and order history live in three tools, someone spends a week reconciling before anyone can read a curve, and the review stops happening. Connecting those events on one customer record is the prerequisite, not the upgrade.
PlatformDTC records subscription plans, renewals, skips, swaps, pauses, dunning and order history against the same customer, and its dunning reads the issuer decline code so a cancel someone chose never gets filed with one they didn't. Any system that holds those events on one record supports the same monthly routine.
PlatformDTC runs subscriptions, renewals, retries, pauses and order history on a single customer record, with analytics that report against real cost inputs like cost per variant, shipping, processing fees and ad spend rather than gross sales alone. That's the grain a cohort review needs, and it's why five numbers can come out of one export instead of three. If you'd rather spend next month reading the curve than reconciling it, start a workspace at PlatformDTC and connect your first plan.